RF power monitoring tools on the cheap
Recently we at @ttncat had to prepare a crash course on LoRa, LoRaWAN and The Things Network for a professional school in Barcelona. It was a 15 hours course that covered from the very basics to some more advanced topics on RF like link budget, attenuation or impedance matching. It was fun to go back to my years at college and revisit and update some of those topics. And at the same time it was a great opportunity to upgrade my toolbox.
I'd like this to be the first of a series of posts about radio frequency. Talking about tools and devices I already had and some of the new ones I now own. I think they might be of some interest for newbies and makers since -due to my budget- they tend to be low cost devices. At least I hope you will find it interesting to know they exist.
I don't pretend to write these posts in any specific order but I'm just starting with what I feel is one of the most basic concepts, and it's that a radio device outputs energy. So maybe one of the first questions is “how much energy?".
RF Power
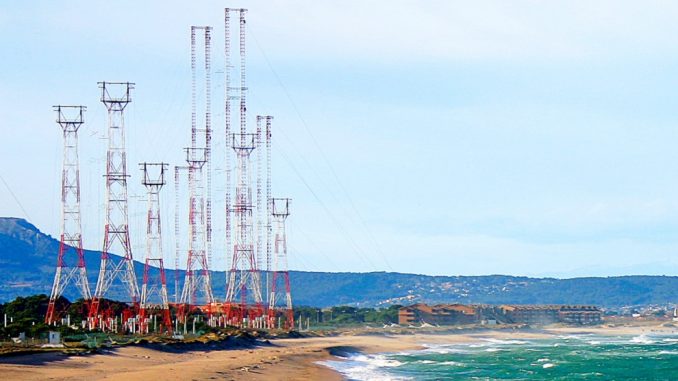
So RF power monitoring is the first step to analyze how a certain radio sends data by quantitatively measuring how much energy it outputs. You probably know this is called “power” and power is measured in Watts (W). Radio Liberty (a CIA-founded organization meant to broadcast anti-comunist propaganda) had a facility in Pals, Girona, from where they could reach as far as Moscow. The facility consisted on 6 radio towers with an overall output of 1.5MW (that's megawatts).
Of course our IoT devices do not output that huge amount of energy. Actually there are several regulators that define how much energy you can use to broadcast messages depending on the frequency you are using. In Europe, the European Telecomunications Standards Institut (ETSI) defines a maximum output of 25mW (that's milliwatts) for the 868MHz band where LoRaWan or Sigfox operate. In the US the FCC allows up to 126mW for the 915MHz band that LoRaWan uses. For the 169MHz band (unlicensed in Europe and used by Wize) the limit is set to 500mW (!!). Still, we are talking 6 to 8 orders of magnitude less that Radio Liberty.
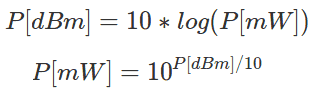
So RF power is measured in watts (or milliwatts for the use cases we are interested in). But, actually, the units you will see all around are dBm (that means decibels referenced to 1 milliwatt). It's just a convenient unit to represent power (also used for other magnitudes). To translate from one to the other you just have to:
Some rules for fast calculations with decibels: 3dB more means doubling the power, 10dB more means 10 times the power. Since decibels is a logarithmic scale you do calculations by adding, while with power you multiply. If you see +30dB it means 1000 times more power, so 30dBm are 1000mW or 1W. The ETSI defines the power limit for each frequency in dBm, so you will actually see that 868MHz is limited to 14dBm (aprox 25mW) and 169MHz is limited to 27dBm (or 500mW).
So, now we know we want to measure dBm. But where? Well, actually there are two different places you might want to measure it:
- The output of your transmitter, connecting your measuring device to the antenna connector of the transmitting device (instead of the antenna)
- The input of the receiver, measuring the power received by the receiver antenna
So let's go now to test the first of the devices I'd like to present you. But before, an advice:
Always connect an antenna to a transmitting device. The role of the antenna is to dissipate the power to the air around (it doesn't require “air” but you know what I mean). If the power is not dissipated it bounces back and it will eventually fry your device. The same can happen if the antenna is not well adapted, i.e. it has a high reflection coefficient for the transmitting frequency. We will learn how to test the antenna adaptation in a future post.
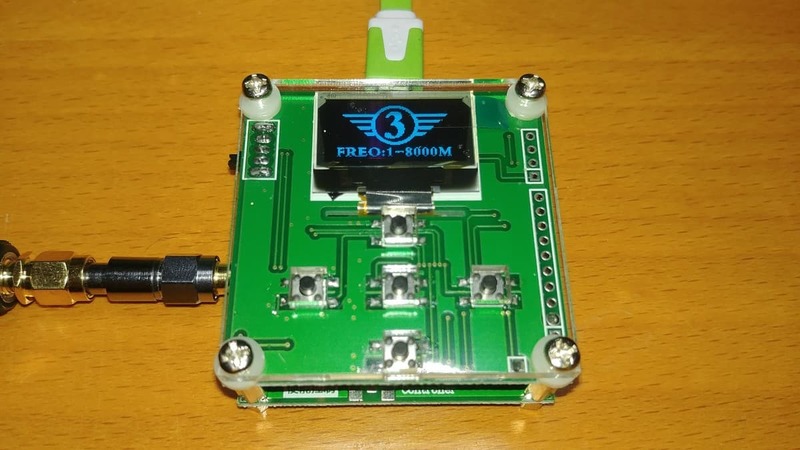
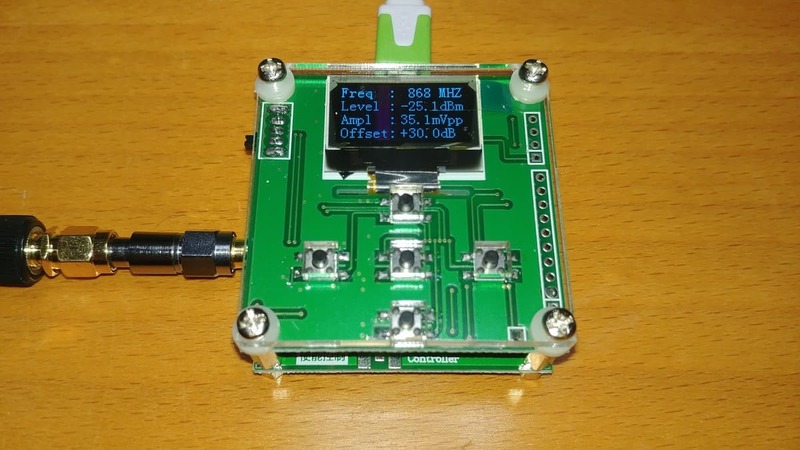
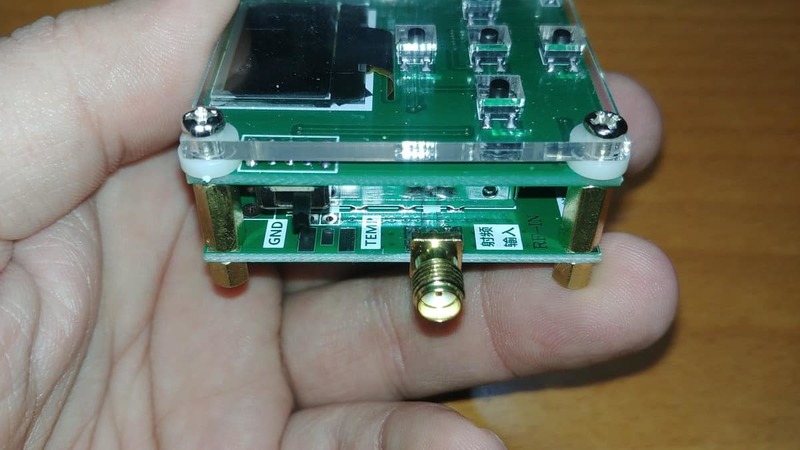
OOTDTY RF PowerMonitor 8000
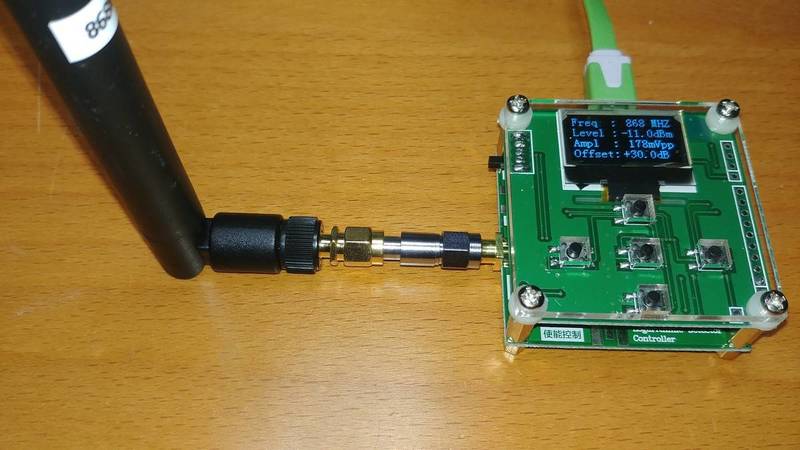
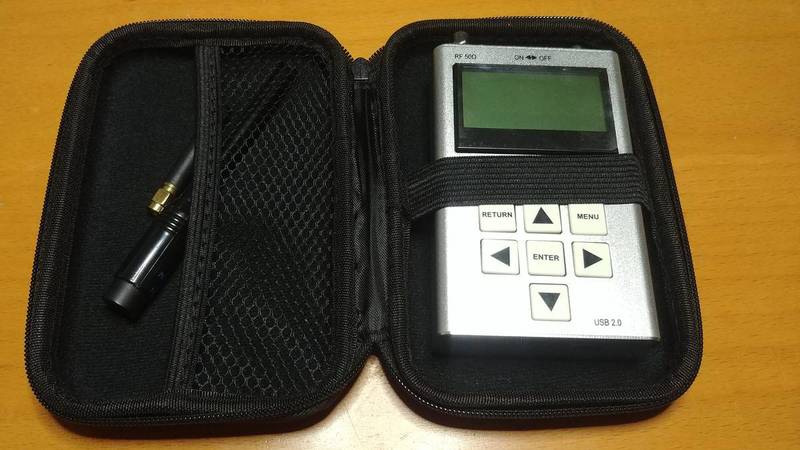
The tool I'd like to present you is the RF PowerMeter 8000 RF [Aliexpress], a cheap power meter you can find on Aliexpress or Ebay for around 23€. There are several versions but the one I have covers up to 8GHz and has a sensitivity range of -45 to -5 dBm (with 0.1dBm steps). It has an ON/OFF switch, an OLED display, 5 buttons, a female SMA connector and it's powered via USB (actually most of the places will sell it to you with a microUSB cable) and you can also monitor the output from your computer using the same USB connection.
Here you have a few pics with underneath caption explaining the few things you have to know about the device.
Since the power range it measures is limited to -45 to -5 dBm it will only let you check the power when directly connected to the transmitting device (using a attenuation) or when really close to it since you will soon get down to -45dBm for a milliwatt radio transmission. In my tests I have gone down to -60dBm and results “look” right but they are out of specs.
Reading it
You can of course read the results in the little OLED screen of the device, but since it also outputs the readings via USB I wrote a small python script to get the readings, calculate the peak value and save them to a CSV compatible file. The devices outputs data at 8 samples per second.
 #!/usr/bin/python

import os
import re
import sys
import glob
import time
import serial

def find_devices(vendor_id = None, product_id = None):
    """
    Looks for USB devices
    optionally filtering by with the provided vendor and product IDs
    """
    devices = []

    for dn in glob.glob('/sys/bus/usb/devices/*'):
        try:
            vid = int(open(os.path.join(dn, "idVendor" )).read().strip(), 16)
            pid = int(open(os.path.join(dn, "idProduct")).read().strip(), 16)
            if ((vendor_id is None) or (vid == vendor_id)) and ((product_id is None) or (pid == product_id)):
                dns = glob.glob(os.path.join(dn, os.path.basename(dn) + "*"))
                for sdn in dns:
                    for fn in glob.glob(os.path.join(sdn, "*")):
                        if re.search(r"\/ttyUSB[0-9]+$", fn):
                            devices.append(os.path.join("/dev", os.path.basename(fn)))
                        pass
                    pass
                pass
            pass
        except ( ValueError, TypeError, AttributeError, OSError, IOError ):
            pass
        pass

    return devices

ports = find_devices(0x1a86, 0x7523)
if len(ports) == 0:
    print("RF Power monitor not found")
    sys.exit(1)
port = ports[0]

ser = serial.Serial(
    port=port,
    baudrate=9600,
    parity=serial.PARITY_NONE,
    stopbits=serial.STOPBITS_ONE,
    bytesize=serial.EIGHTBITS,
    timeout=0
)

print("Connected to: " + ser.portstr)

pattern = re.compile("\$([\s0-9.-]+).*\$")
max = -60
start = time.time()

try:
    while True:
        line = ser.readline()
        result = pattern.match(line)
        if result:
            dbm = float(result.group(1).replace(" ", ""))
            if dbm > max:
                max = dbm
            t = int(1000 * (time.time() - start))
            print("{0:06d},{1}".format(t, dbm))

except KeyboardInterrupt:
    None

print()
print("Peak: " +  str(max))
print()

ser.close()
This script is released under the Lesser GPL v3 license as free open software and can be checked out at my RF-Tools repository on GitHub.
Monitoring TX power
Connecting it
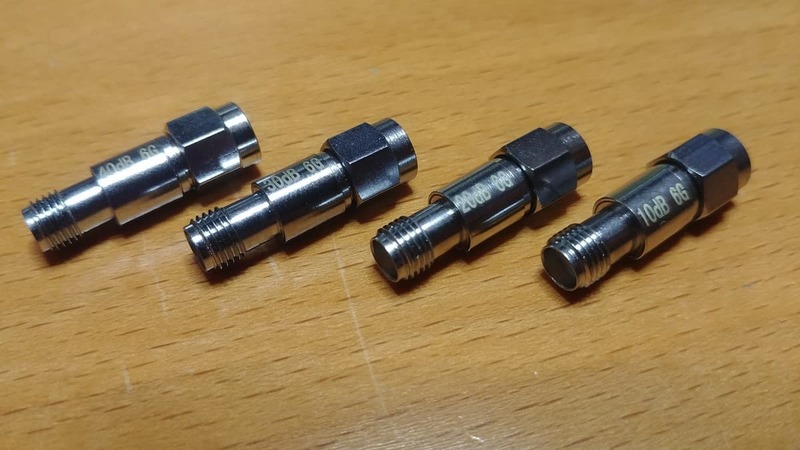
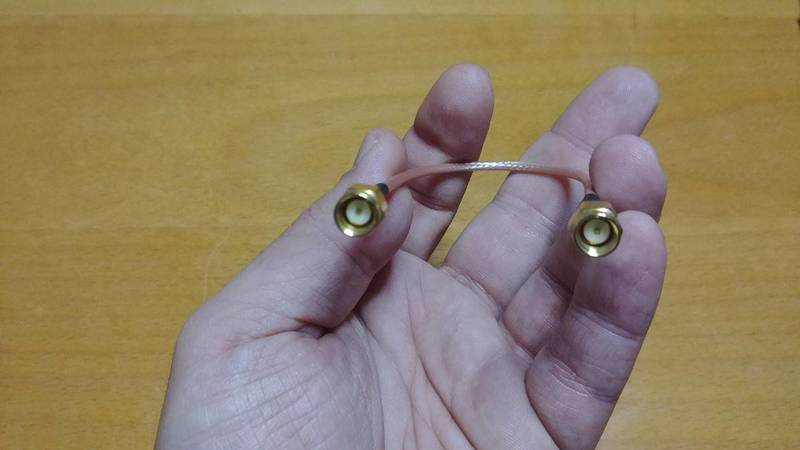
When connecting the power meter to a transmitter you will need an attenuator (to reduce the output power so it is less than -5dBm), a SMA male-to-male cable and maybe some adapters (SMA female-to-female, SMA to RP-SMA,…). In the picture below you can see a transmitter (an M5Stack node I use as a tracker) connected using a SMA-male to SMA-male cable and 30dBm attenuator.
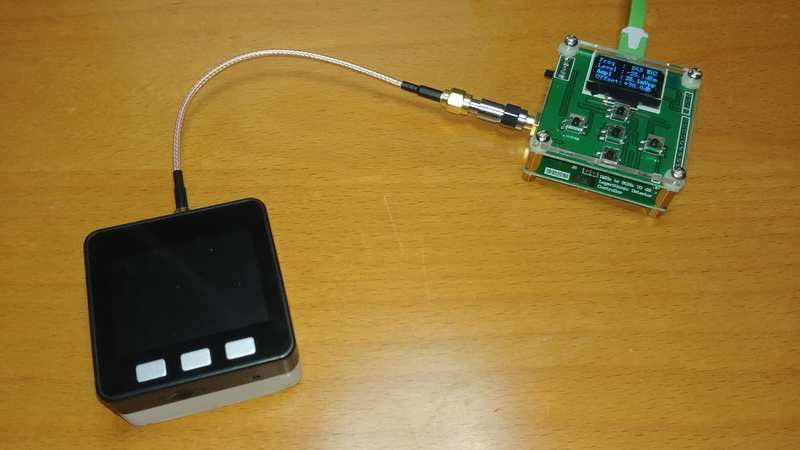
There is a shopping list at the end of this post but here you have pictures of the different components.
Tests
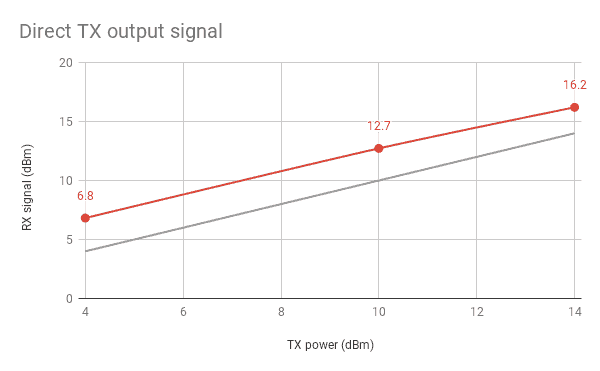
So I run a few tests for 3 different TX power settings. Since 868MHz is limited in the EU to 14dBm I run the tests for 14, 10 and 4dBm. To do it I simply modified the original tracker sketch. I'm using MCCI Catena LMIC library which might be a little different from the original LMIC library for Arduino.
First I set it to use on only channel 0 at 868.1MHz.
// Set up the channels used by the Things Network, which corresponds
// to the defaults of most gateways. Without this, only three base
// channels from the LoRaWAN specification are used, which certainly
// works, so it is good for debugging, but can overload those
// frequencies, so be sure to configure the full frequency range of
// your network here (unless your network autoconfigures them).
// Setting up channels should happen after LMIC_setSession, as that
// configures the minimal channel set.
LMIC_setupChannel(0, 868100000, DR_RANGE_MAP(DR_SF12, DR_SF7),  BAND_CENTI);      // g-band
LMIC_setupChannel(1, 868300000, DR_RANGE_MAP(DR_SF12, DR_SF7B), BAND_CENTI);      // g-band
LMIC_setupChannel(2, 868500000, DR_RANGE_MAP(DR_SF12, DR_SF7),  BAND_CENTI);      // g-band
LMIC_setupChannel(3, 867100000, DR_RANGE_MAP(DR_SF12, DR_SF7),  BAND_CENTI);      // g-band
LMIC_setupChannel(4, 867300000, DR_RANGE_MAP(DR_SF12, DR_SF7),  BAND_CENTI);      // g-band
LMIC_setupChannel(5, 867500000, DR_RANGE_MAP(DR_SF12, DR_SF7),  BAND_CENTI);      // g-band
LMIC_setupChannel(6, 867700000, DR_RANGE_MAP(DR_SF12, DR_SF7),  BAND_CENTI);      // g-band
LMIC_setupChannel(7, 867900000, DR_RANGE_MAP(DR_SF12, DR_SF7),  BAND_CENTI);      // g-band
LMIC_setupChannel(8, 868800000, DR_RANGE_MAP(DR_FSK,  DR_FSK),  BAND_MILLI);      // g2-band

// If using a mono-channel gateway disable all channels
// but the one the gateway is listening to
//LMIC_disableChannel(0);
LMIC_disableChannel(1);
LMIC_disableChannel(2);
LMIC_disableChannel(3);
LMIC_disableChannel(4);
LMIC_disableChannel(5);
LMIC_disableChannel(6);
LMIC_disableChannel(7);
LMIC_disableChannel(8);
Second I set spreading factor to 12 using the LMIC_setDrTxpow method so the message takes longer and I can get several readings during the transmission:
void ttn_sf(unsigned char sf) {
    LMIC_setDrTxpow(sf, 14);
}
But even thou the second parameter in the previous call is the transmitting power, the library does not seem to change it so instead I'm changing the power per-band using the LMIC_setupBand method:
void ttn_pow(unsigned char pow) {
    LMIC_setupBand(BAND_CENTI, pow, 100);
}
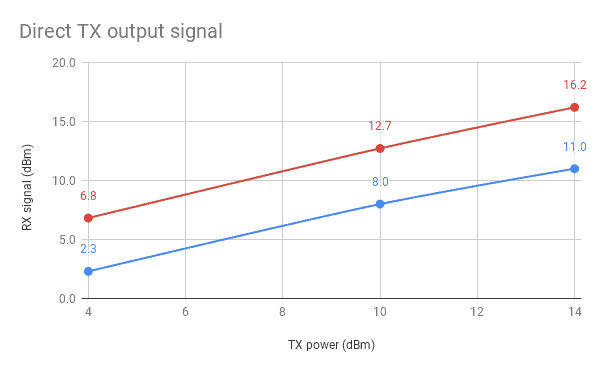
The results for the tests are shown in this graph. As you can see there is an offset from the nominal power that's pretty constant, but surprisingly the offset is positive, i.e. the reading is stronger than the nominal power…
Monitoring RX power
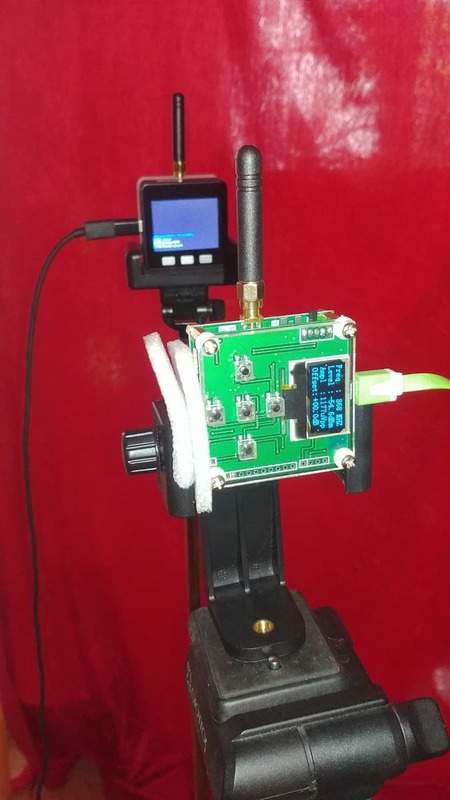
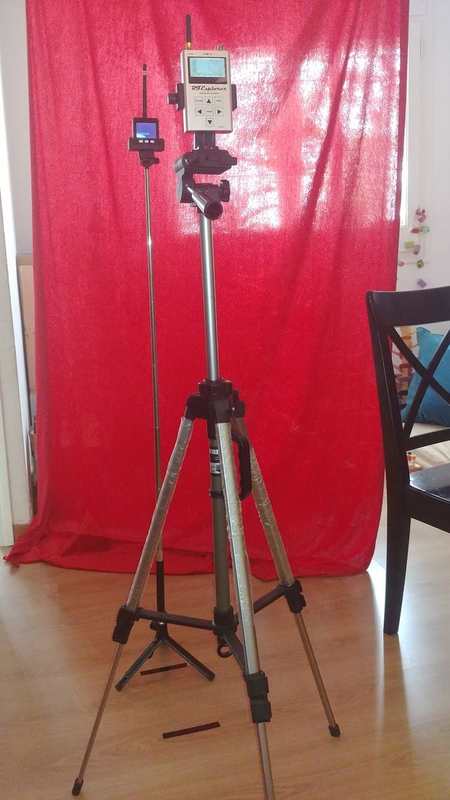
Monitoring RX power is done, obviously, by connecting an antenna to the RF power monitor. Of course the quality of the antenna will impact on the results and profiling an antenna is one of the main goals but I don't want to focus now on this. Suffice to say I checked and used two different antennas that had a good enough response for the 868MHz frequency.
Again, depending of the antenna connector you might need SMA adapters like the one in the picture above. You might still need attenuators for close distances, a 10dBm attenuation should be enough for most cases.
| TX power | 25cm | 50cm | 100cm | 200cm |
|---|---|---|---|---|
| 14 | -2.3 | -7.4 | -15.3 | -17.3 |
| 10 | -5.3 | -12.9 | -18.4 | -20.7 |
| 4 | -11.8 | -17.8 | -22.9 | -28.7 |
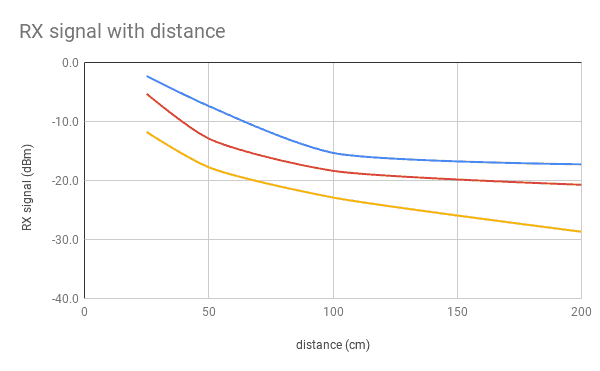
As you can see the readings are pretty much the expected. From one series to the other the distance is close to the TX power difference. On the other hand the RX power is reduced by ~5.1dBm (with a standard deviation of 1.5dBm) when doubling the distance. This falls inside the expected value which is 6dBm loss when doubling distance. This is a result of the formula above and the fact than the power loss at a certain distance is proportional to the square of the distance.
So apparently the results from the RF PowerMeter 8000 are compatible with the theory. But what if we compare it with another device?
Comparison
I happen to own an RF Explorer too (my next post will probably deal with it). So I did the exact same tests using it and compared the results.
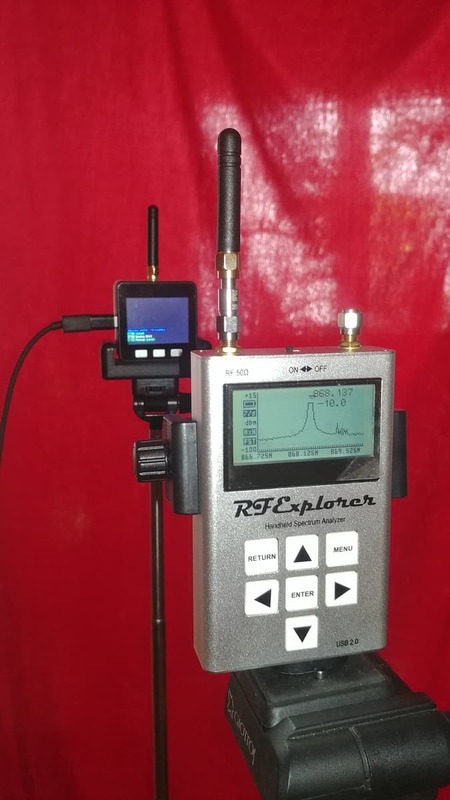
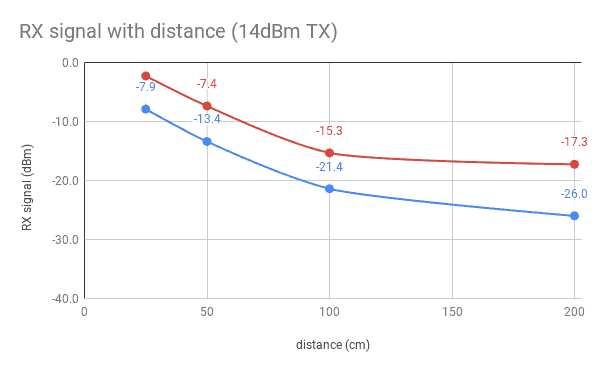
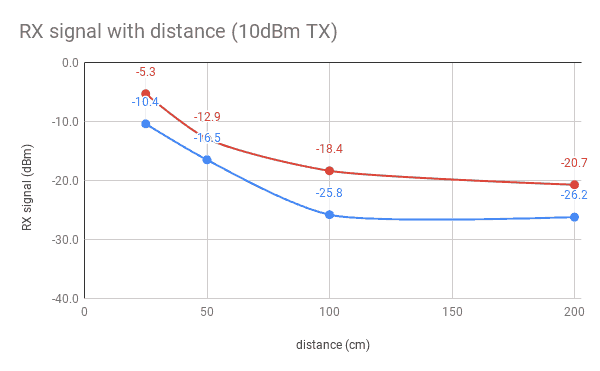
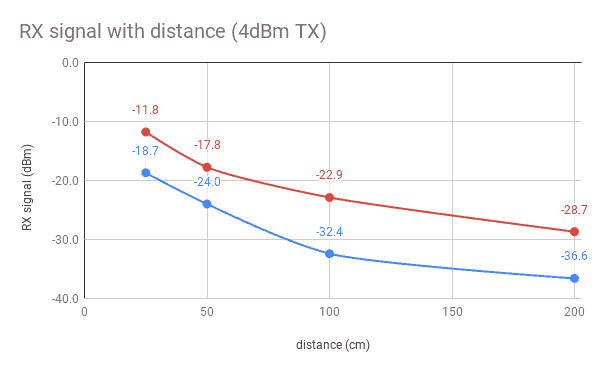
As you can see in the graphs above, the readings of the RF PowerMonitor 8000 are consistently higher than those from the RF Explorer. This is actually good news since the offset is pretty constant. The calculations give 6.1dBm offset with a standard deviation of 1.6dBm and the numbers get better if we only take into account short distances and very stable for direct power measuring.
Conclusions
Let me first say that I'm comparing a 23€ device to a 246€ one. Both might be considered low-cost since actual RF monitoring equipment is way more expensive, but still there is a factor of 10 in cost between them. That said, my opinion based on the results is that the RF PowerMonitor 8000 is a really good piece of hardware for its price tag and it's worth investing on it. Unless you already have some other equipment, of course.
Let me summarize my conclusions here:
- The RF PowerMonitor results are consistent with those from the RF Explorer, albeit they do show an offset. It requires calibration.
- A cheap way to calibrate the device is to get the readings form a direct TX output and calibrate them to aprox. 2dBm less than the nominal value to take connection losses into account. This is consistent with the results from the RF Explorer.
- The offset gets worst with distance, maybe due to the fact that the power readings are closer to the sensitivity threshold of the device (around -45dBm).
- Still, for short distances they are steady and this means the RF PowerMeter 8000 can be used to compare antenna gains.
Shopping list
These are the tools I've used during this post. These are affiliate links to Aliexpress or Ebay. If you plan to buy any of these components and you use the link I provide you will be helping me maintaining this blog. Thank you.
| Component | Price Aliexpress (EUR) | Link Aliexpress | Price Ebay (USD) | Link Ebay |
|---|---|---|---|---|
| OOTDTY RF Power Meter | 22.91 | Aliexpress | 33.78 | Ebay |
| RF Explorer (3G Combo) | 246.22 | Aliexpress | 269 | Ebay |
| RF Explorer (WSUB1G) | 146.3 | Aliexpress | 135.45 | Ebay |
| Atenuators (10-20-30-40dB) | from ~3 to ~6 | Aliexpress | ||
| SMA male to RP-SMA female | 0.71 | Aliexpress | ||
| SMA male to SMA male (10x) | 0.38 | Aliexpress | ||
| SMA female to SMA female (10x) | 0.24 | Aliexpress | ||
| SMA male to SMA male cable | 0.81 | Aliexpress | ||
| Terminal SMA | 1.1 | Aliexpress |
"RF power monitoring tools on the cheap" was first posted on 14 April 2019 by Xose Pérez on tinkerman.cat under Analysis and tagged antenna, attenuator, dbm, decibels, energy, etsi, lora, lorawan, m5stack, milliwatts, ootdty, power, power meter, rf explorer, rf power, sma, the things network, toolbox, ttn, wize.